What is a Yield Curve?
The yield curve is a graphical representation of the yields on government bonds of different maturity dates at a given time, typically involving treasury securities in the United States. Under normal circumstances, the curve slows upward because bonds with longer maturities generally offer higher yields to compensate investors for the increased risk of holding them for extended periods. The short end of the curve represents bonds with shorter maturities (such as one month to 2 years), while the long end features bonds with longer maturities (10 to 30 years).
Understanding Inverted Yield Curves
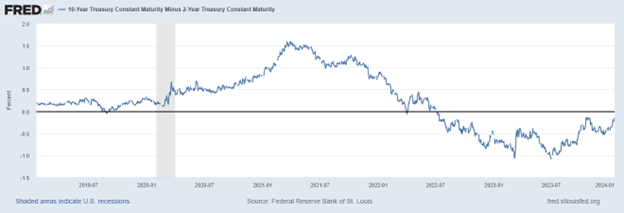
An inverted yield curve occurs when short-term interest rates exceed long-term rates. This phenomenon signifies that investors require more yield for locking in their money for a short period than holding it for a longer term. This unusual circumstance indicates a belief that the near-term holds more risk than the long-term, which suggests a need for more confidence in the near-term economy.
Why an Inverted Yield Curve Signals a Recession
There are several hypotheses on why inverted yield curves are precursors to economic recessions:
Expectations Theory: The yield curve reflects market expectations. An inverted curve suggests that investors expect future interest rates to fall because they anticipate a slowdown in economic growth, which leads to lower inflation and, therefore, lower long-term interest rates.
Liquidity Preference Theory: Banks borrow money on short-term markets and lend at longer maturities, earning the interest spread. An inverted curve flattens or negates that spread, making it less profitable or unprofitable for banks to lend, which can constrict credit and business investment, eventually leading to a recession.
Market Sentiment: An inversion may also reflect a change in market sentiment. When the curve inverts, it can contribute to a self-fulfilling prophecy as businesses and consumers cut back on spending, expecting a downturn, which then causes the economy to contract.
Historical Performance as a Recession Predictor
The inversion of the yield curve has been a reliable indicator of impending recessions in the United States:
Early 1970s Recession: The yield curve inverted in 1969, preceding the recession in late 1970, and lasted through 1971.
Early 1980s Recessions: The yield curve inverted in 1978 and again in 1980. Both times, the economy went into a recession within a year, with 1981-1982 being one of the more severe downturns.
Early 1990s Recession: In 1989, the yield curve inverted again, and a mild recession followed in 1990-1991, marked by a slump in manufacturing and a credit crisis for commercial and savings banks.
Early 2000s Recession: The most famous inversion occurred in the late 1990s, which predicted the early 2000s recession. The burst of the dot-com bubble and the September 11 terrorist attacks contributed to this downturn.
Global Financial Crisis of 2007-2008: A yield curve inversion happened in 2006, a couple of years before the global financial crisis. This crisis started with the housing bubble bursting, leading to the worst economic downturn since the Great Depression.

Inverted Bond Yields, Recessions: The Current Scenario
The current scenario regarding inverted bond yields and recessions is paramount in understanding the economic landscape. Recent developments in the market have raised concerns and have the potential to impact the economy significantly. We have had a continuous Inverted bond yield from July 6, 2022, through January 17, 2024.
According to data from the Federal Reserve Bank of San Francisco, an inverted yield curve has accurately foreshadowed all ten recessions since 1955. The U.S. Treasury yield curve is a go-to gauge for many seasoned investors regarding economic forecasts.
One primary concern is the inverted yield curve, which occurs when long-term bond yields fall below short-term bond yields. This phenomenon has historically been associated with economic downturns and is a warning sign for potential recessions.
Conclusion
Considering the concern raised by an inverted yield curve—an event renowned for its historical tendency to foreshadow economic downturns—retirees must proceed with the utmost caution in managing their investments. The appearance of this phenomenon is a manifest reflection of prevailing investor trepidation and forward-looking expectations. As such, it demands heightened vigilance in observing economic indicators and perhaps necessitates a prudent reassessment of investment approaches.
For those dependent on their retirement savings, it’s particularly crucial to prioritize stability and safeguard against the potential fiscal tumult that recessions may inflict. In this vein, fixed index annuities stand out as a stalwart option, providing a bulwark against market volatility. These vehicles offer a dependable income stream, with the return potential tethered to a market index but without the attendant direct market risk – a bastion of security in inclement financial climates.
It is worth noting, however, that an inverted yield curve is but one tool in the analytical arsenal and should not be the lone guiding star in navigating investment decisions. Although historical concurrence exists between yield curve inversions and economic recessions, it is critical to understand that this correlation does not equate to causation. Prudent investors and analysts should survey a broad tableau of economic indicators to form a more comprehensive view of the impending financial landscape.
I cordially invite you to contact Carolina Benefits Group for a complimentary consultation to explore the full array of conservative investment avenues that may suit your retirement strategy. We aim to illuminate a path that aligns with your aspirations for a secure retirement, considering the unique intricacies of your financial picture.
Source Links
- https://fortune.com/recommends/investing/the-inverted-yield-curve-recession/
- https://www.newyorkfed.org/research/capital_markets/ycfaq#/
- https://www.frbsf.org/economic-research/publications/economic-letter/2018/march/economic-forecasts-with-yield-curve/
- https://fred.stlouisfed.org/series/T10Y2Y#
